Best Crypto Indicators For 1 Hour Trading Strategy
Learn a time-proven Crypto and ETH trading strategy to earn profit on the hourly chart. Follow the best crypto indicators for day trading.

The biggest profit in the crypto markets, such as Ethereum trading, is made by day trading. This is because Cryptocurrency price movements happen in flashes. It only takes a matter of hours for trends can change completely. Here we will look at the best crypto indicators for a 1 hour trading strategy. The idea is to enable you to capitalize on the smaller market movements.
There is less chance to be burnt making shorter lasting trades, specifically, day trading. You may have even labelled off crypto trading as being a game of chance, however, there’s much more to it. One way to ensure results is to use the best crypto signals for day trading. If you need help buying crypto, then check out our guide on buying Ethereum with a bank card instantly.
Best Crypto Indicators when day trading
With day trading, you can take advantage of all the smaller price movements. Which do get overlooked when analysts break down the long-term trends of the industry. Furthermore, when trading cryptocurrency off an hourly chart you can use these indicators for any market trend. It doesn't matter if it is bearish or bullish. This is interesting even if you plan to be a long-term Ethereum or Altcoin holder. As markets do go through periods of being stagnant - where you will question your long term investment decision.

On the other hand, if you monitor charts with smaller time-frames then you can make endless profitable trades. Because there are always price movements at smaller time frames. Remove emotions, and trade the chart.
1. Advantages Of The 1 Hour ETH Chart
First let’s take a look at this weekly chart ETH/USDT chart:
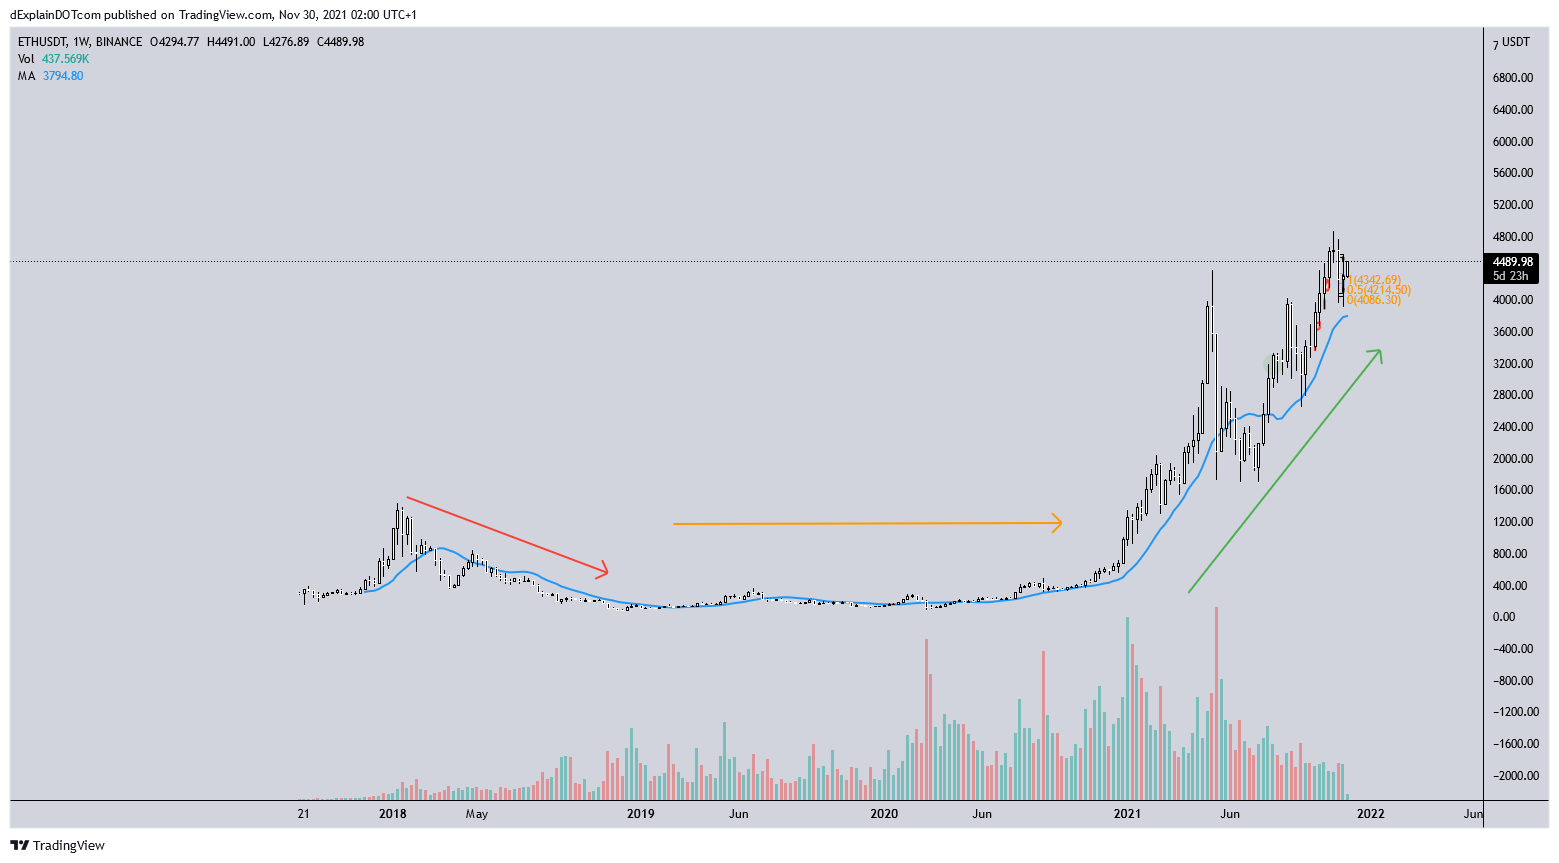
You can definitely see 2020 started with upwards momentum, but to make profitable trades watching a weekly chart, you need to be able to catch the brief spikes - such as the top in February. And those brief spikes are hard to catch, aren’t they? Now, let’s take a look at a 1 Hour ETH/USDT chart:
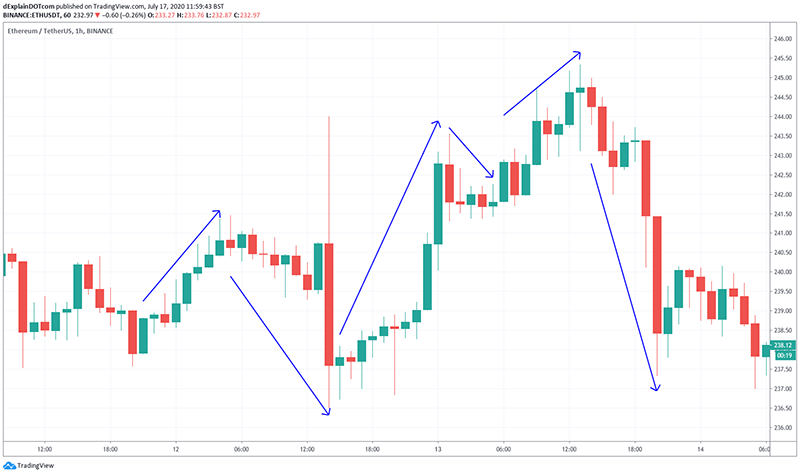
Looks much more interesting, right?
As you can see, 2020 Ethereum price movements may look like it has only had one upwards movement to those who place their trades only looking at the long-term picture. The 1H chart is painting a different picture. Using the best crypto indicators for day trading lets you spot many different opportunities on the ETH/USDT market - 24 hours a day if we want to be precise.
There are three major benefits of trading cryptocurrency at lower time frames off a 1 hour chart:
- Making more trades means you have more opportunities to make profits.
- You can still trade in the direction of the bigger time frames to catch profits from long-term trends.
- Sticking to smaller trades ensures that losses are smaller.
2. Best Crypto Indicators For Day Trading
Momentum indicators are the most relevant when trading the 1-Hour chart. This is because these types of indicators react faster to market movements. Remember we are looking to capitalize off price movements within smaller time frames. The faster an indicator reacts, the less likely it is giving us a wrong signal.
With that in mind, our besy crypto indicator of choice for trading the 1 Hour Ethereum chart is the MACD. Let’s take a look at a trade:
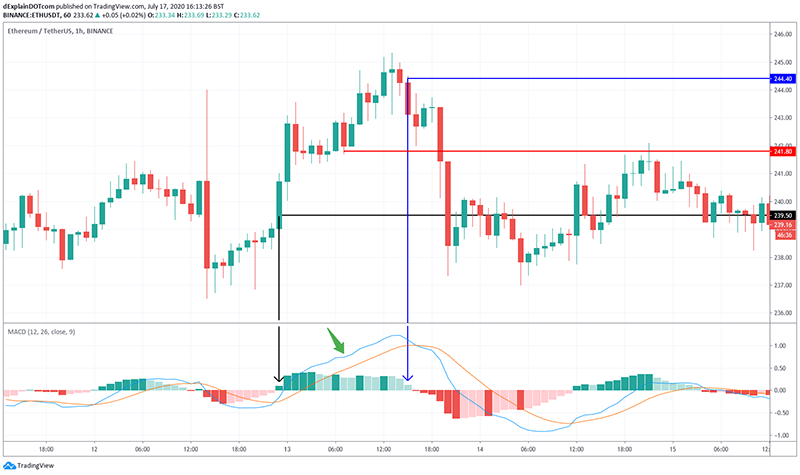
Here, after the MACD showed me a crossover (the blue line crossed over the orange line) which indicates growing momentum, I entered a trade at the 239.50 mark. For the moment this looks like it will be a fairly standard trade, however, the interesting part happens at the 241.80 mark where I nearly panic exited the position. This was due to seeing that big red candlestick.
This is where sticking to the fundamentals of your day trading strategy is crucial, because we can clearly see the MACD is not showing another crossover (the big green arrow). So there is no reason for me to believe a reversal is going to happen.
Whereas when we get to my exit point, at the blue mark 244.40, we can see that the MACD is indicating the end of the upwards trend. We can see that the histogram is starting to move towards negative numbers. This was confirmed very shortly after with a downwards crossover, followed by the ETH price plummeting down. A very nice profitable trade, which sets you up perfectly to buy back in at the next crossover.
RSI Trading Indicator
Lastly, no day trader working off momentum indicators would be complete without the RSI. Let’s take a look at a trade using our second best crypto indicator known as the Relative Strength Index.
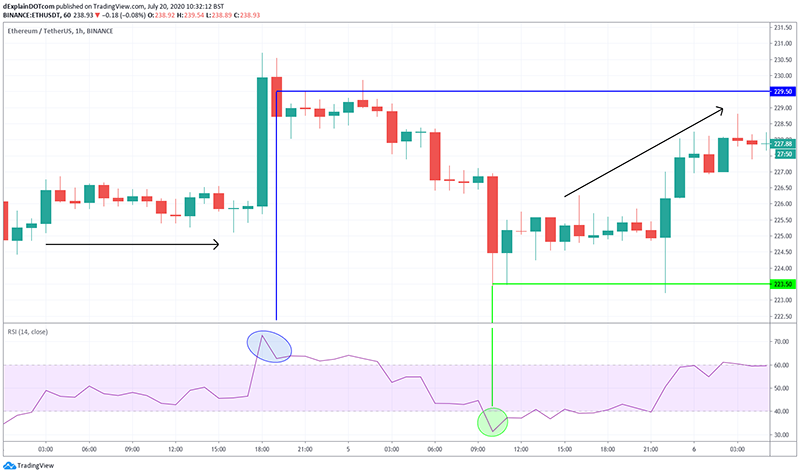
Here, we have an example of a trade starting from the other direction, where I have been holding ETH while the market has been in a sideways direction (the first black arrow on the left). The massive green candle broke the sideways trend which could indicate the market is breaking out into a bullish trend, but we also see that the RSI indicates it has become immediately overbought. As the RSI has crossed over 70 this is an indication that the market is overbought. I can now expect that this breakout will most likely turn out to be a fakeout.
As a result, once the big bullish candle closed I aggressively placed a SELL order and was able to sell at the 229.50 mark. The next candle closed lower, meaning that my expectations of a fakeout were further confirmed. I decided to let the trend ride for a bit as the downwards momentum started, currently, I am holding USDT - so looking for my next entry point.
Quick tip: I recommend setting your RSI indicator to highlight between the 60 to 40 levels which will allow you to quickly react to any market movement towards overbought or oversold conditions.
After some regular checking, the price had plunged and the RSI was heading below the 30 level. An RSI below 30, indicates that the market is becoming oversold and we can expect a reverse trend soon. With this in mind, I placed a buy order at the 223.50 mark which set me up nicely to ride the market’s new upwards trend.
 mf_reason
These are my favorite techniques when day trading. You can learn how to use them on Binance in the following tutorial. I recommend using the best crypto indicators outline in our article when day trading. It is a good idea to use both the RSI and MACD indicators combined when trading, as you can use one indicator to confirm the other. If you enjoyed this trading tutorial be sure to check out some of our other cryptocurrency guides.
Take care and trade well.


